14/04/2026
Q1 2026 Settlement and Monitoring Data
Please find links below to the CREST settlement & monitoring data for Q1
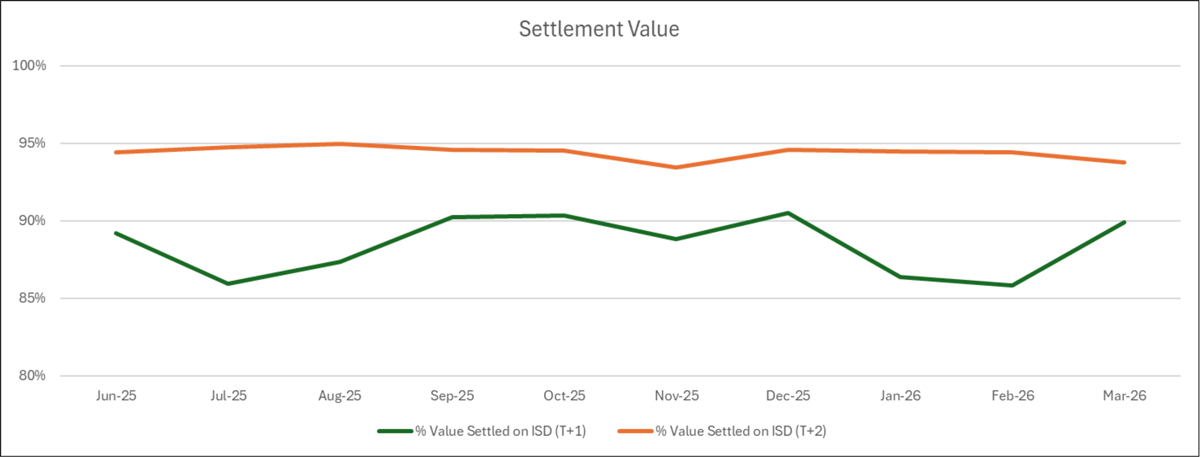
The green line equates to the percentage of settlement (by value) that were entered for and settled on T+1
The orange line equates to the percentage of settlement (by value) that were entered for and settled on T+2 (current market practice)
As can be seen there is a gap (approx 6%) between the settlement performance of T+1 transactions and the performance of T+2 transactions
Visualise the latest data at a glance
Euroclear UK & International matching and settlement monitoring – Graphs
Dive into the data behind
These files present data for the periods indicated relating to bilateral standard deliveries (i.e. not cleared by a CCP) of equities, split by their security category.
